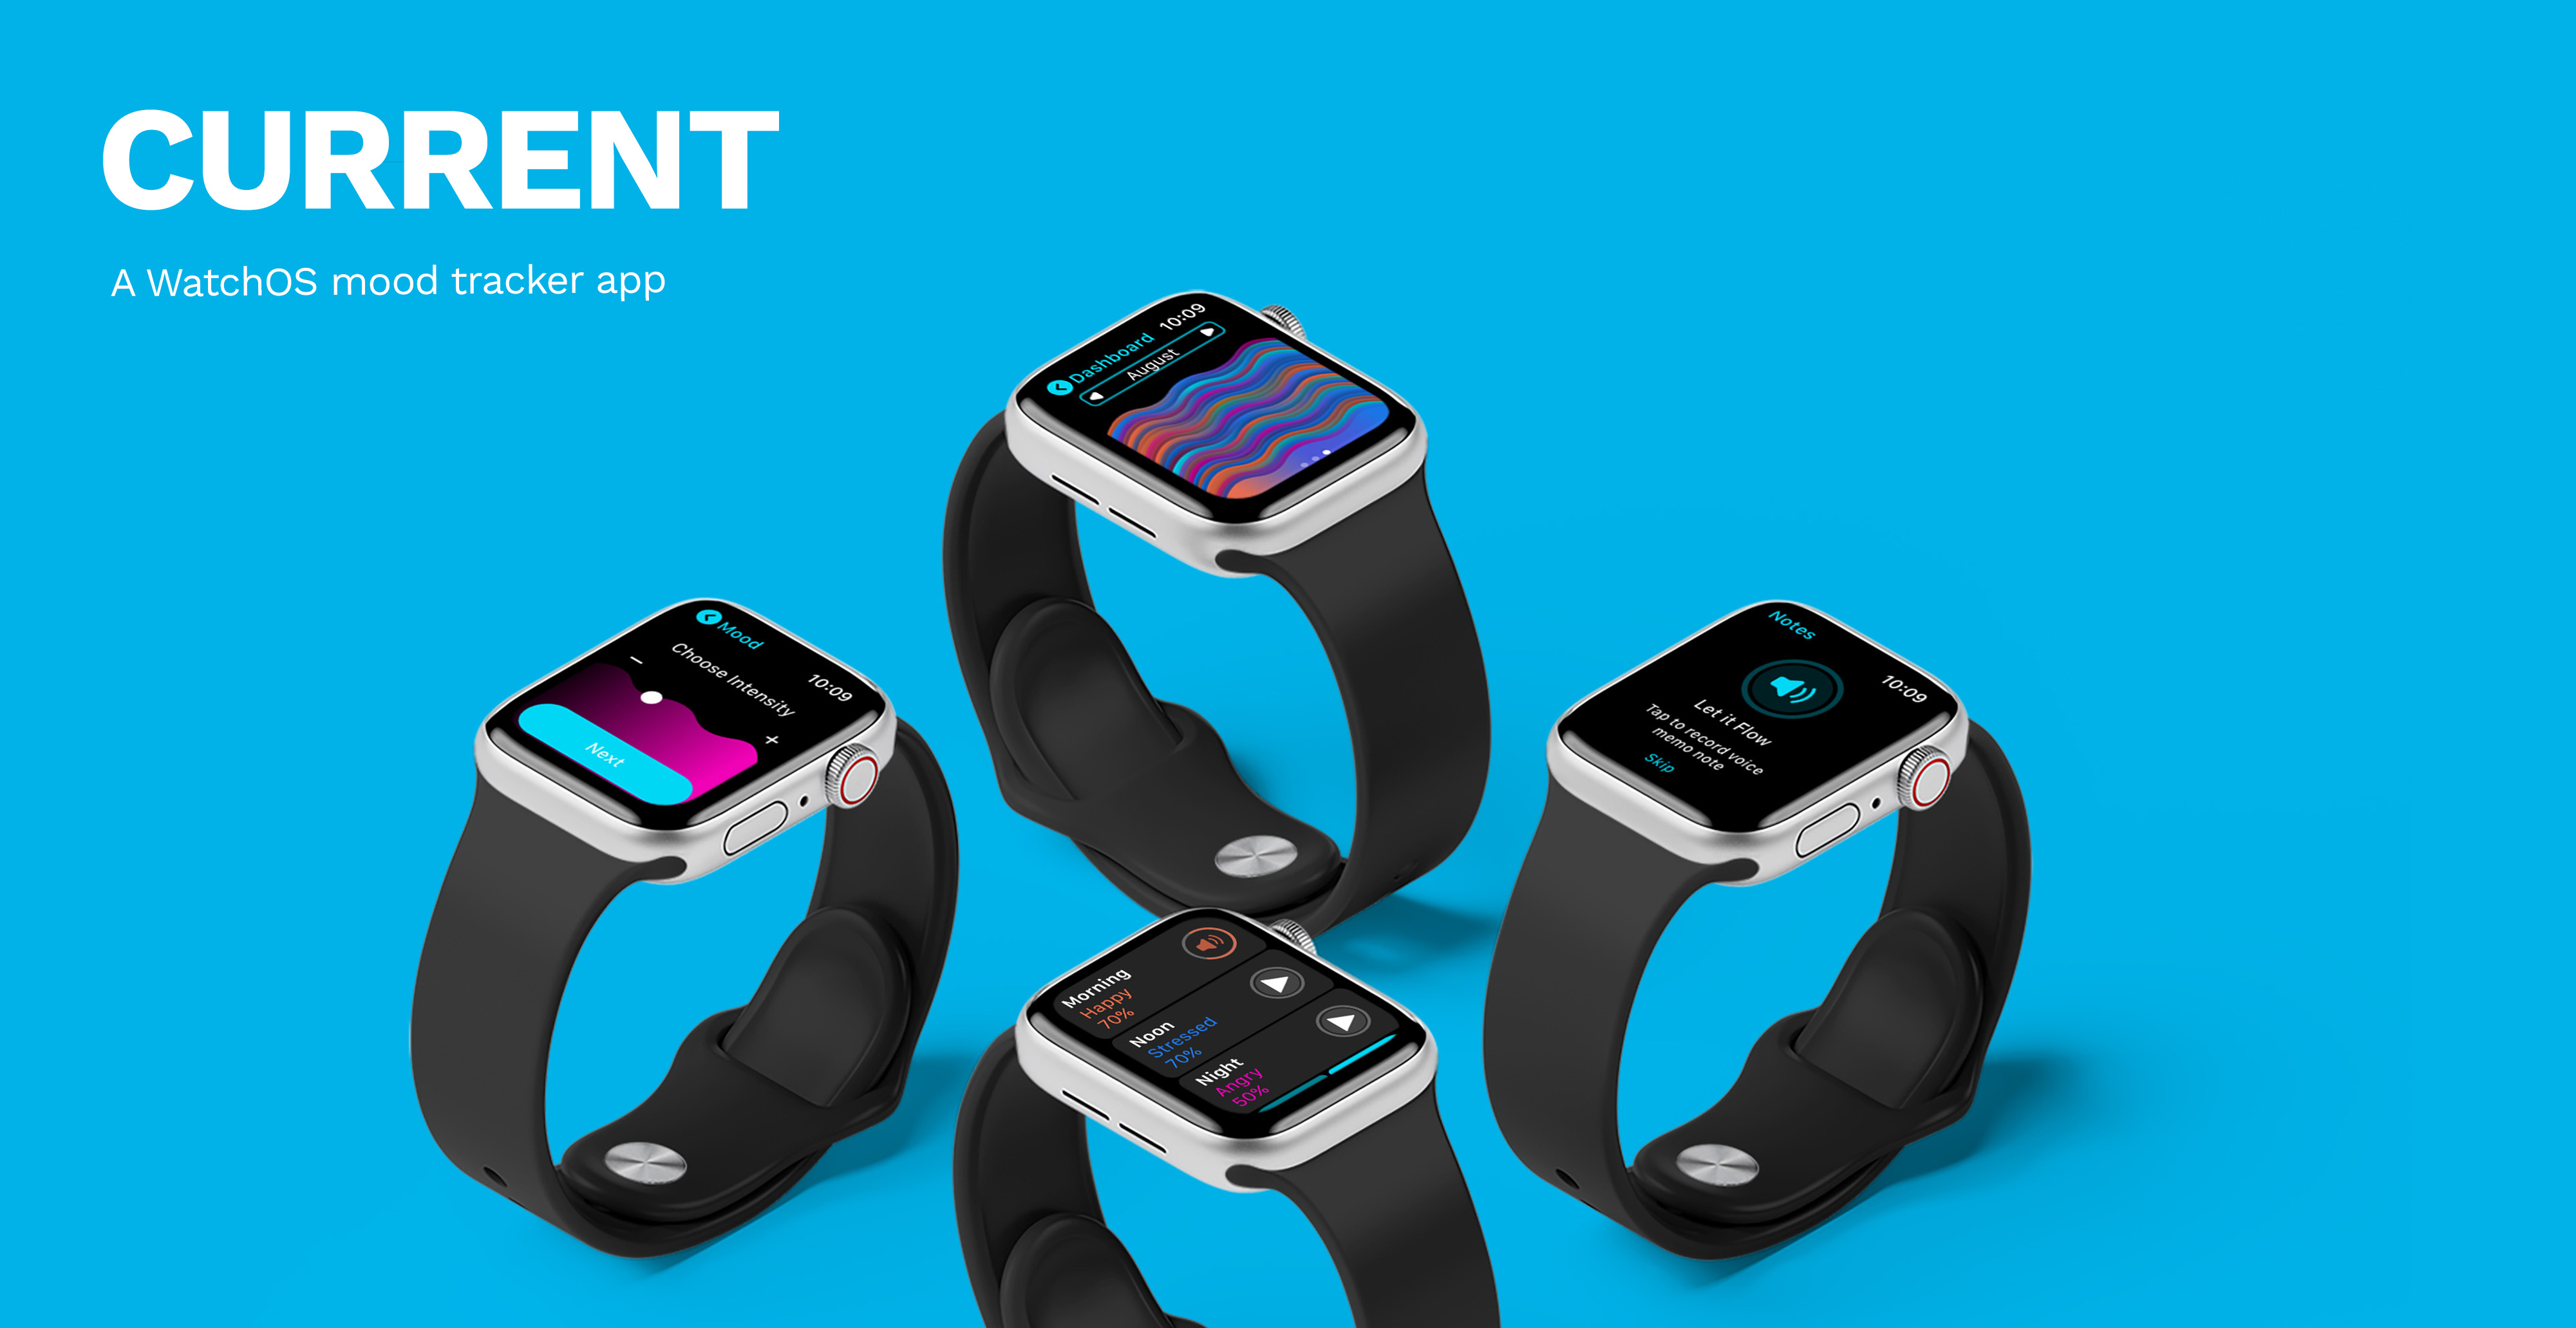
THE APP
Users can track their mood 3 times a day; morning, noon, and night. To record data, a user will first select the date and time, then choose a mood, mood intensity, and have the option to record a note.
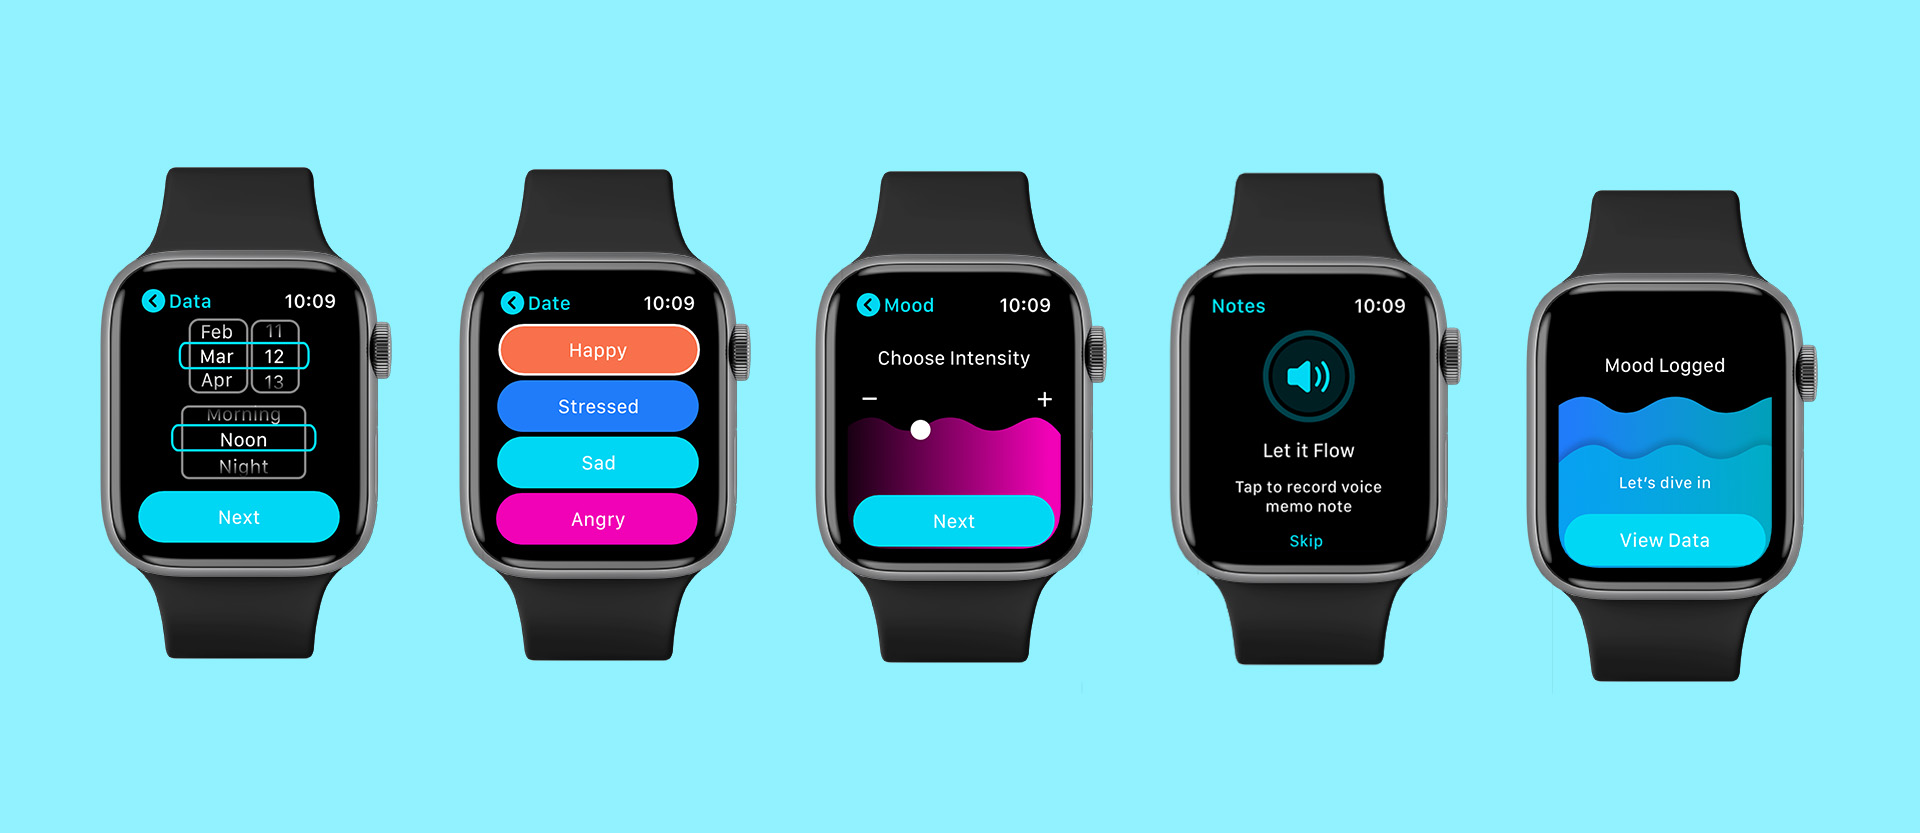
THE PROTOTYPE
DATA VISUALIZATIONS
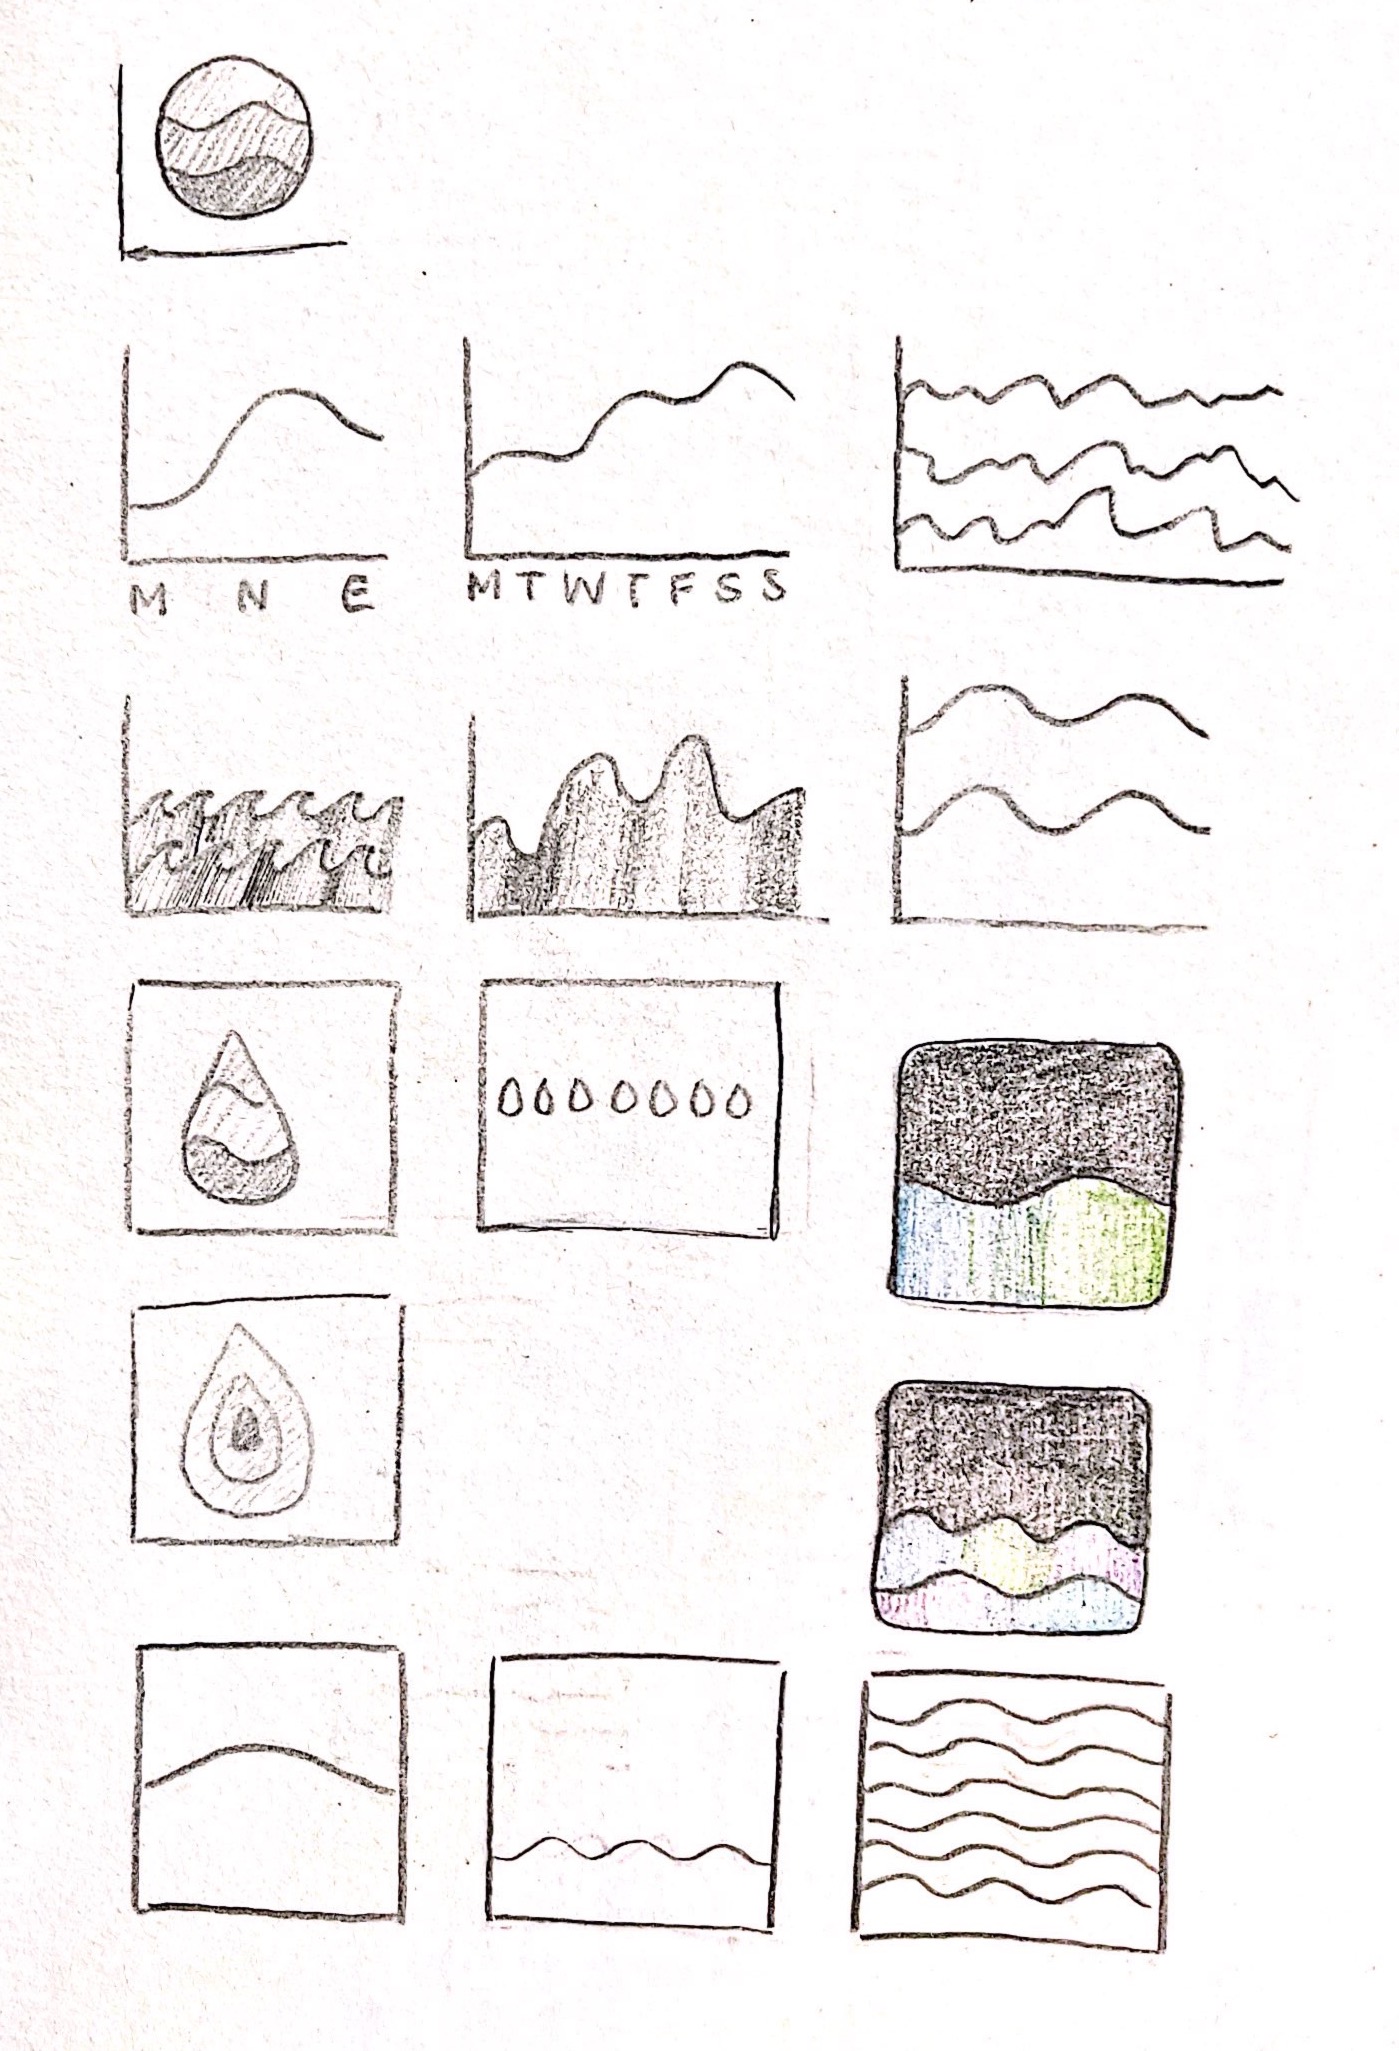
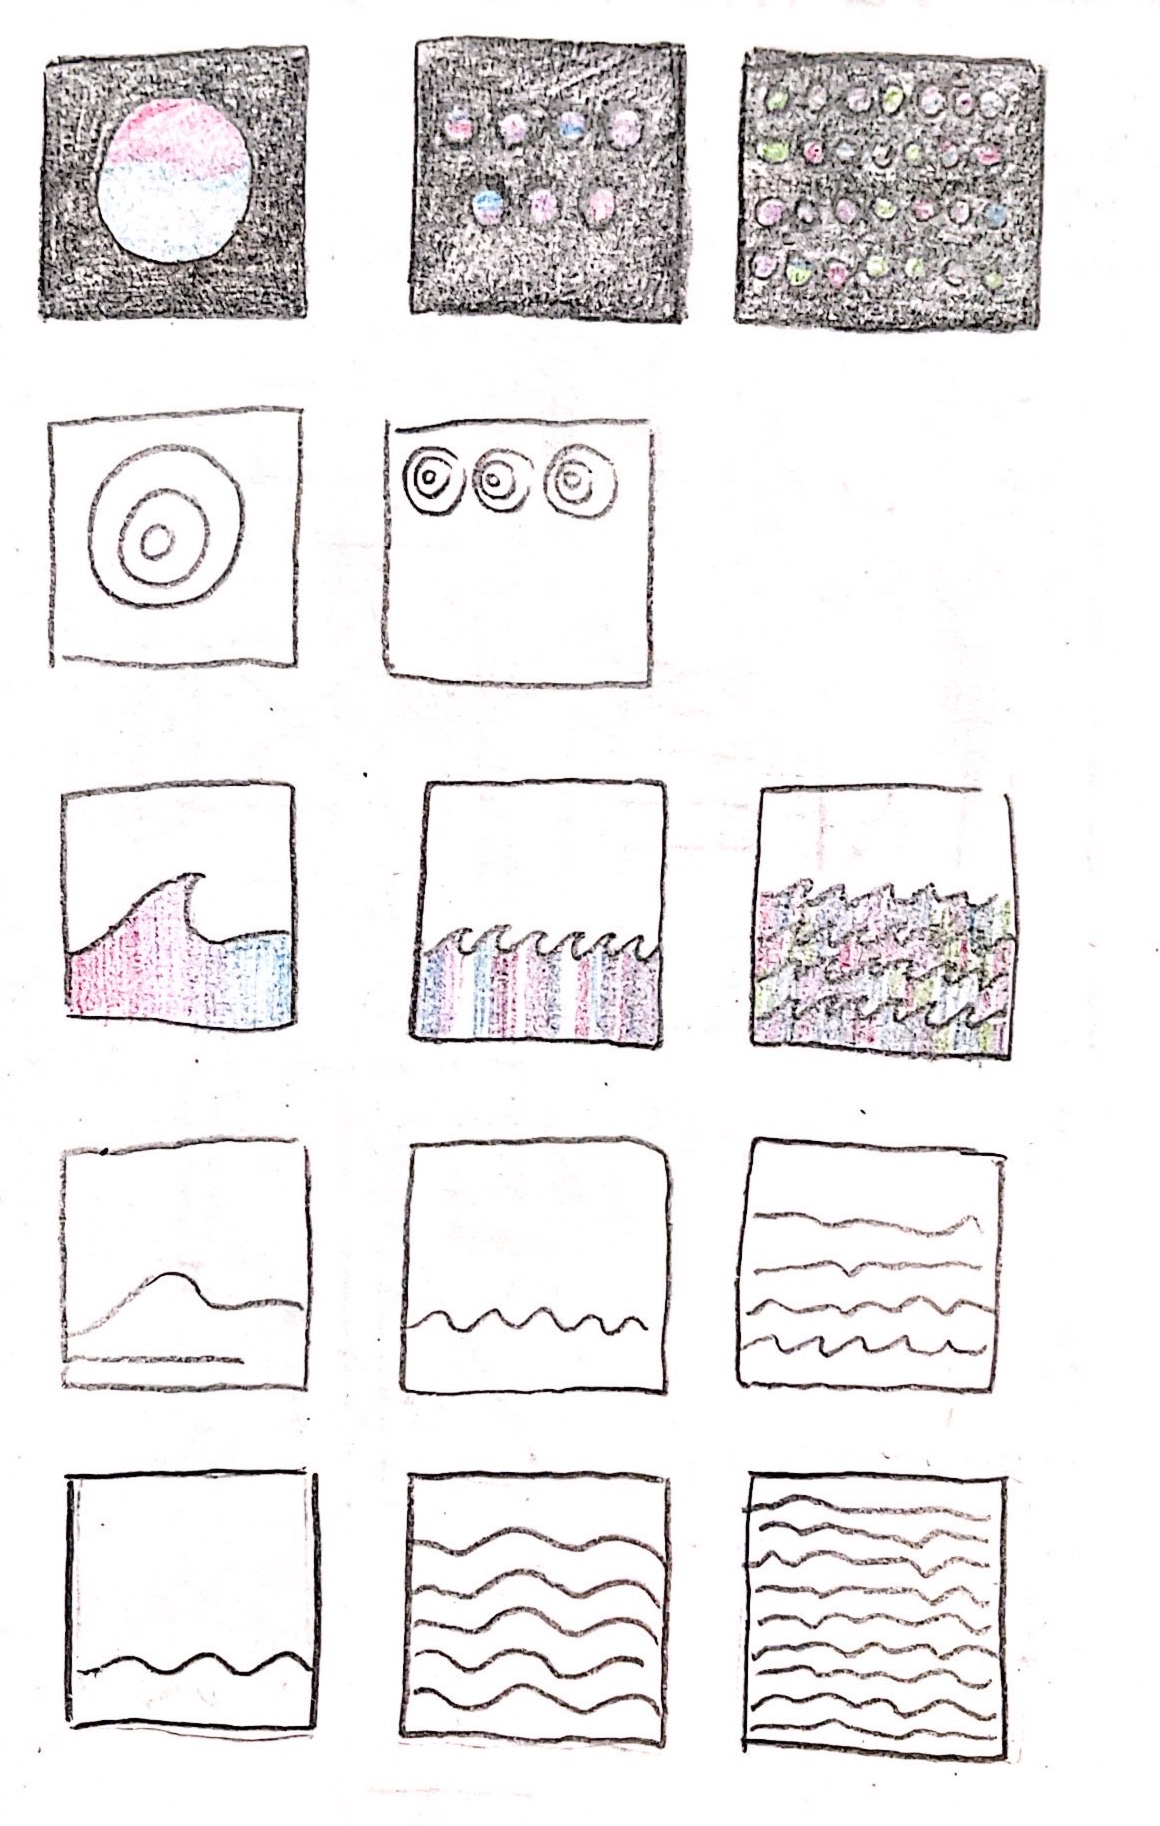
As users log their mood throughout the day, a data visualization is formed to represent their daily moods. The visualizations are presented in the form of waves, where users can recognize mood patterns in color and intensity.
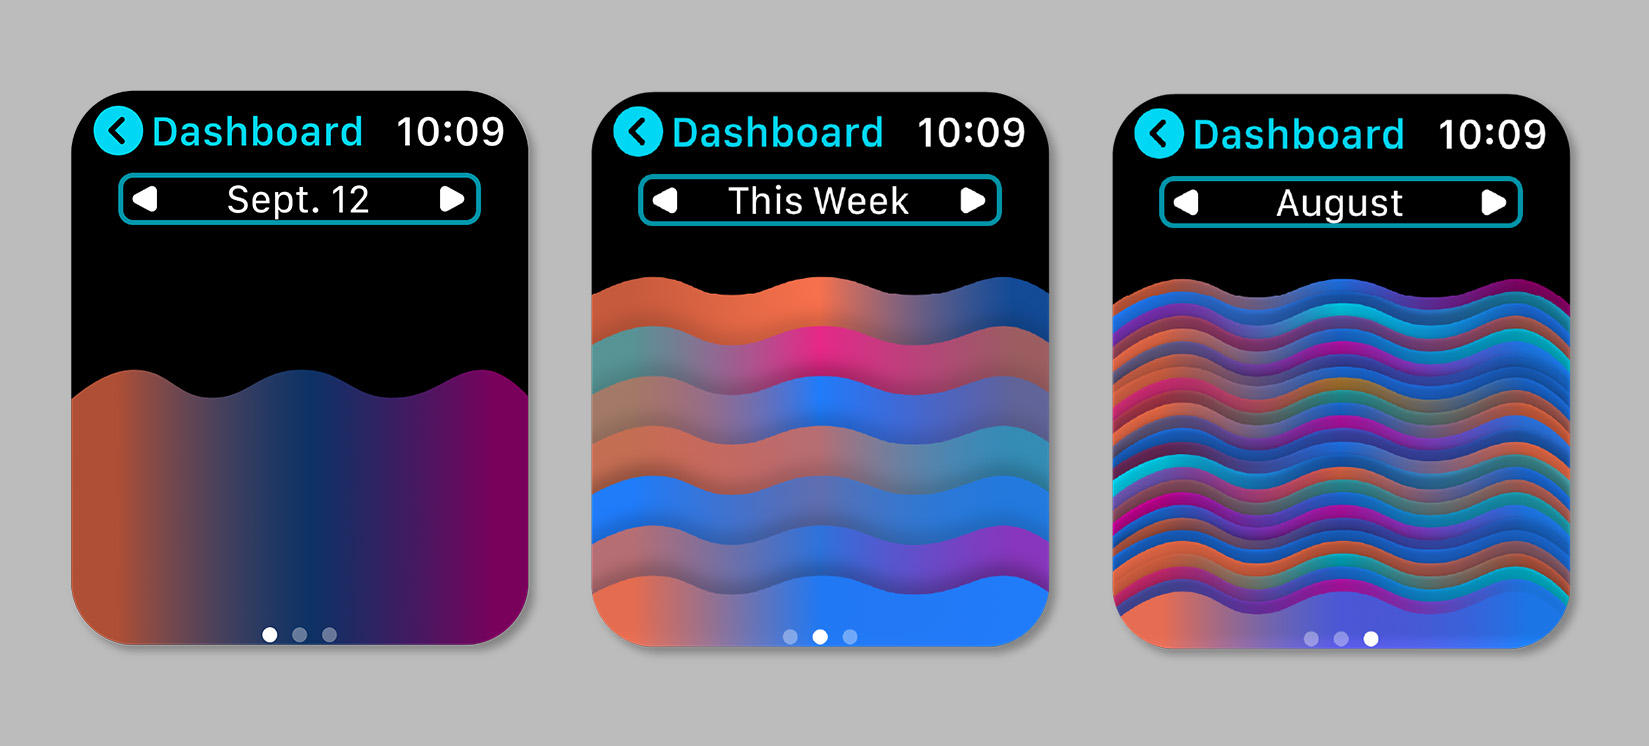
After testing combinations of various wave amplitude, color, opacity, and frequency, I landed on the final version shown above because it is the easiest for users to interpret. When there is space between the lines of data, it adds an additional layer of information for the viewer to comprehend. The waves are solid shapes, making it easier for the viewer to see patterns of intensity and repeating colors.

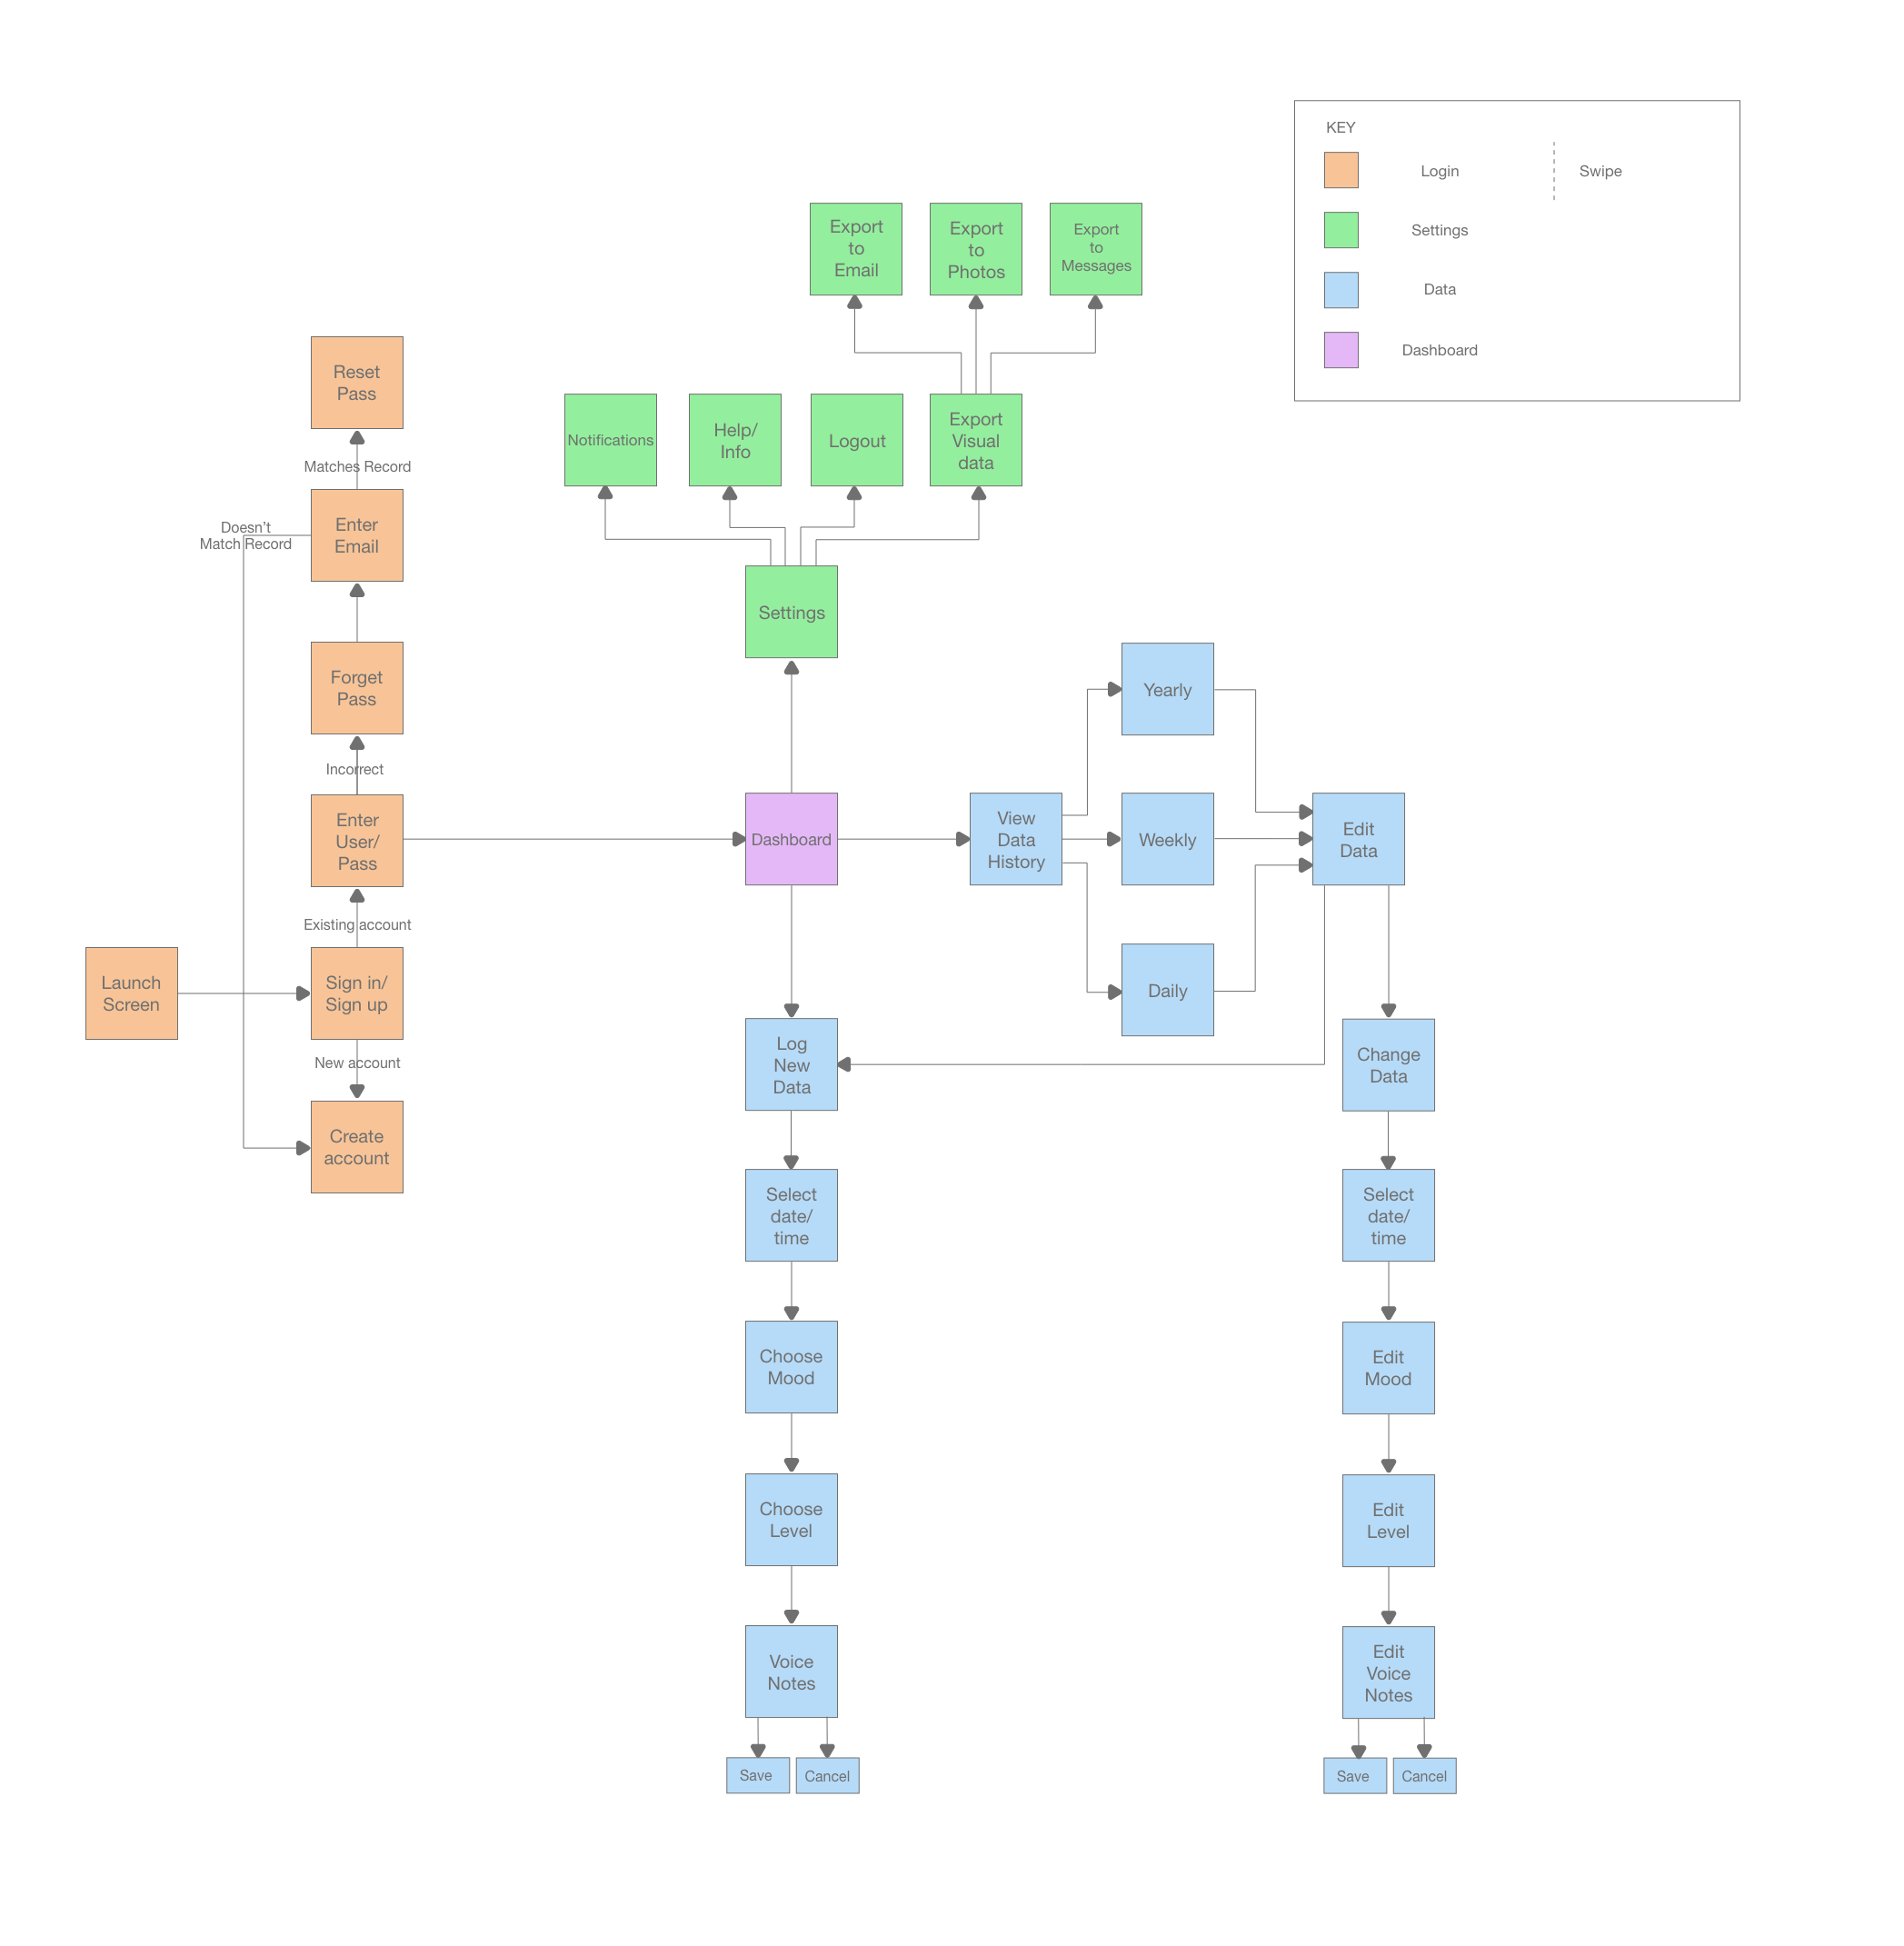
MOODBOARD & USERFLOW